Performance tuning with XRebel and friends
Analysing and optimising the performance of a complex web application using XRebel, Chrome Dev Tools and the IntelliJ IDEA Profiler.

Just before Christmas I was presented with a performance problem in one area of Tabula, our student administration system. This area supports the exam board process at the University - this is where committees sit at the end of each academic year and collates the marks for sets of students, and produces decisions around progression or degree classifications.
The system is effectively a customised report. A significant amount of information needs to be pulled from the student records system, augmented with information in Tabula itself, and then formatted in particular ways with a significant amount of variance between different areas of the University. The amount of data that's needed to pull this together can be complicated, it can include:
- Student information for students fitting the criteria for the report (typically students on a particular year of a particular course)
- Modules that a student is registered on and the marks for individual assessment components (coursework and exams) and the overall module mark
- Breakdowns of the number of credits with scores over particular thresholds (commonly, how many credits have been "passed")
- Year marks, which can become very complicated it has to take into account the course regulations for which modules can be taken. If a student takes more than the minimum required credits, their overall mark is the best subset of modules that meets the course regulations. We'd normally display this alongside weighted means and other helpful calculations
- A suggested result (proceed, resit or pass) and, for finalists, a suggested final degree classification
There's also various formatting rules for how this information is presented. Anyway, in short, it's complicated. We'd built a system that fit the requirements, but was agonisingly slow; there are two stages to the process. First, the system generates a preview and displays that in an HTML table. This can then take modifications or notes, before a grid is generated for download as an Excel workbook. The first step of this, the preview, was taking multiple minutes even for relatively simple grids, so let's dig into our toolkit and work out what's going on.
XRebel
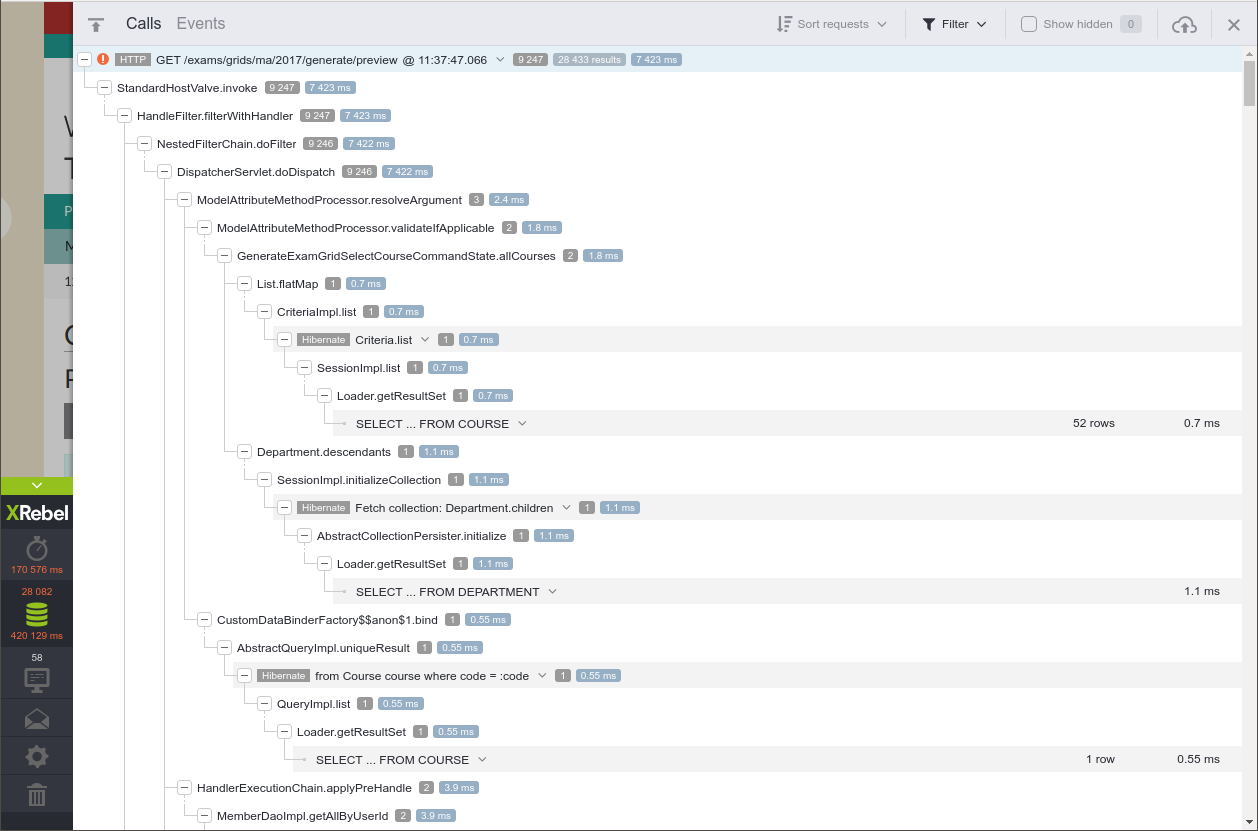
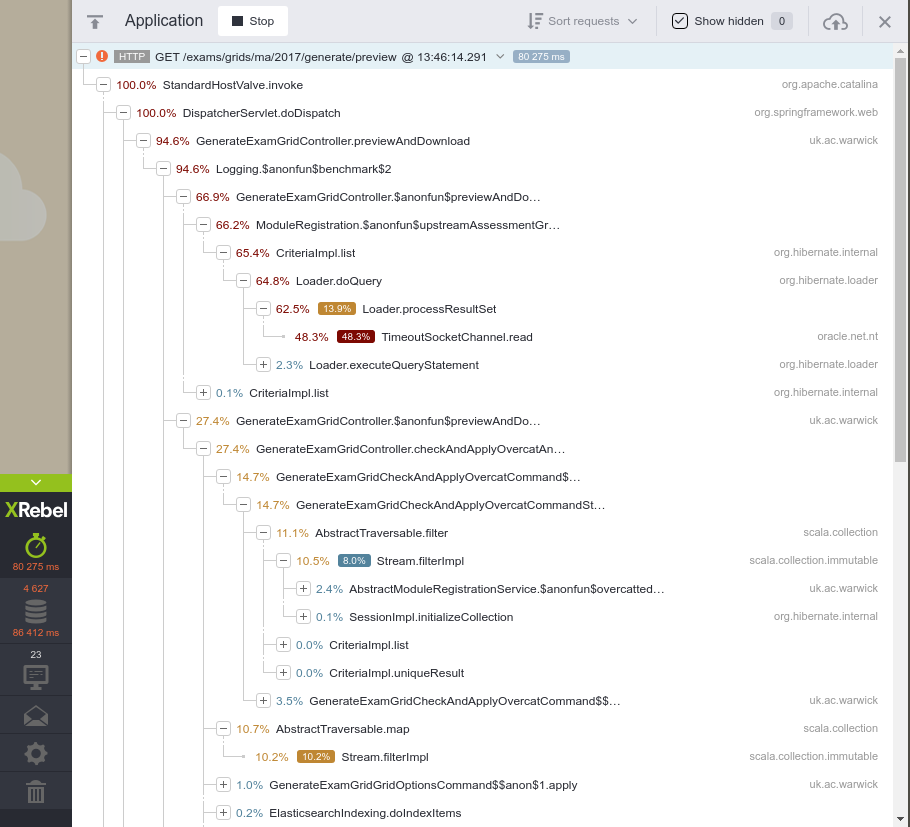
XRebel is a Java agent that injects into a running servlet container to provide real-time transactional profiling and other information (such as the database queries being run). We can see from the screenshots below that there's a wealth of information here, down to individual method times.
Here's a trace taken from Tabula 2018.12.2, released mid-December before the performance work started:
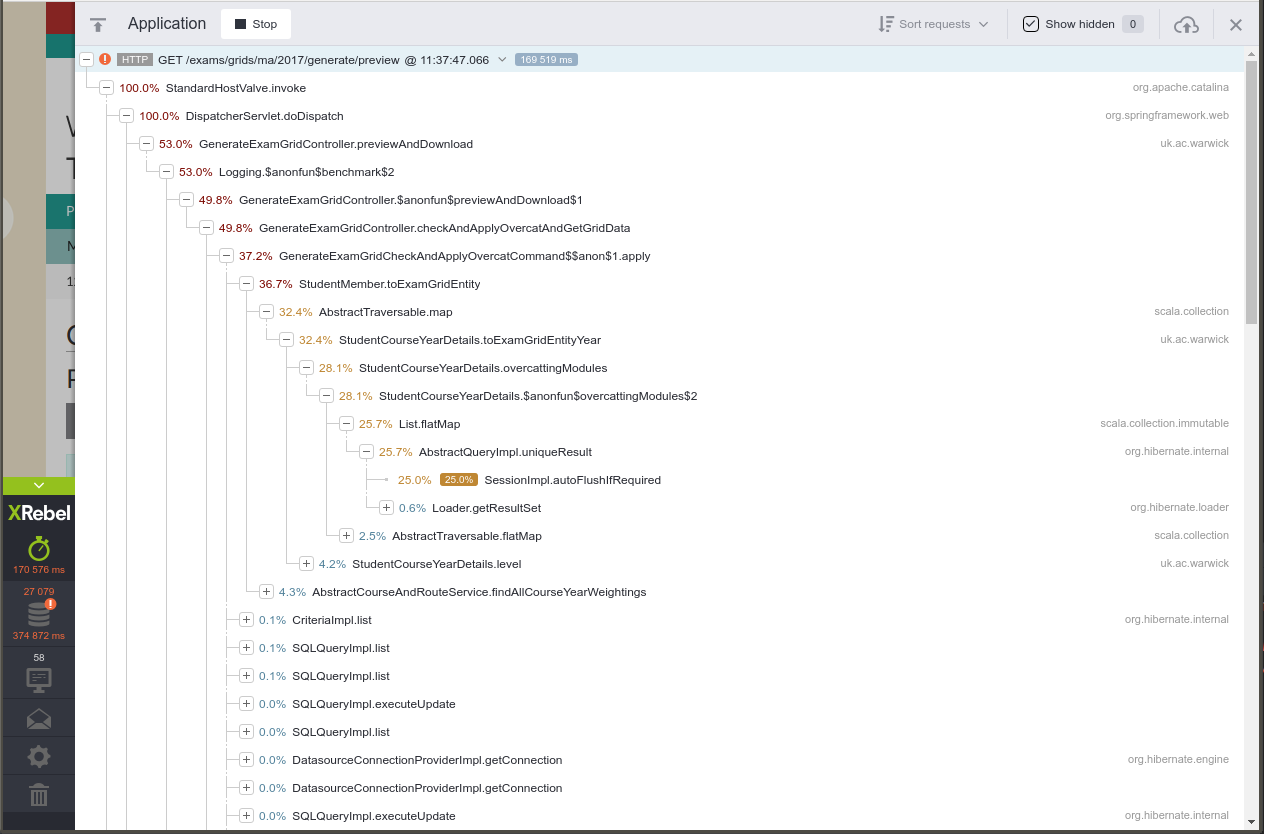
Some takeaways from the initial analysis here:
- 50% of the time spent rendering HTML from the Freemarker template is massively suspicious
- Over 9,000(!) SQL queries to build this page
- Other than that, the vast majority of the time is spent getting combinations of modules that students take that fit the course regulations
The moving parts here were a little overwhelming, and a little out of date. We were a major version behind on Spring and Hibernate, and several minor versions behind on Freemarker. As it turned out, the latter was the most important part here.
When objects are passed into the map for Freemarker, Freemarker wraps them in its own implementations to allow them to be used in a template, so when you pass in a List or a Map, Freemarker will wrap them in its own implementation to allow them to be used in <#list> or other Freemarker built-ins.
As it turns out, the way that it did this in v2.3.21 (the version we were using) involved copying the entire collection into the Freemarker equivalent (SimpleHash or SimpleSequence), which was inefficient. Compounding that (massively), we had our own helpers to get an element of a hash by a non-String key, which required unwrapping the object each time, inadvertently creating another copy of the hash in memory. Unsurprisingly, this was hugely inefficient, but actually fixed in the next minor release, v2.3.22, which wraps the object in an adapter rather than creating a copy. When we were looking to reduce the amount of time we spent in Freemarker, this trivial version bump (to the latest) was actually the most important change we made.
As we were going down the rabbit hole, we also did all the other dependencies at the same time. This meant we got some improvements in how Hibernate handles its session cache which reduced some duplicate queries we were running, but we also re-worked a lot of our database code to not rely on Hibernate lazy-loading collections and to cache the results of some expensive operations for the duration of the request.
As a result, by the end of January the performance profile of running exactly the same page looks very different:
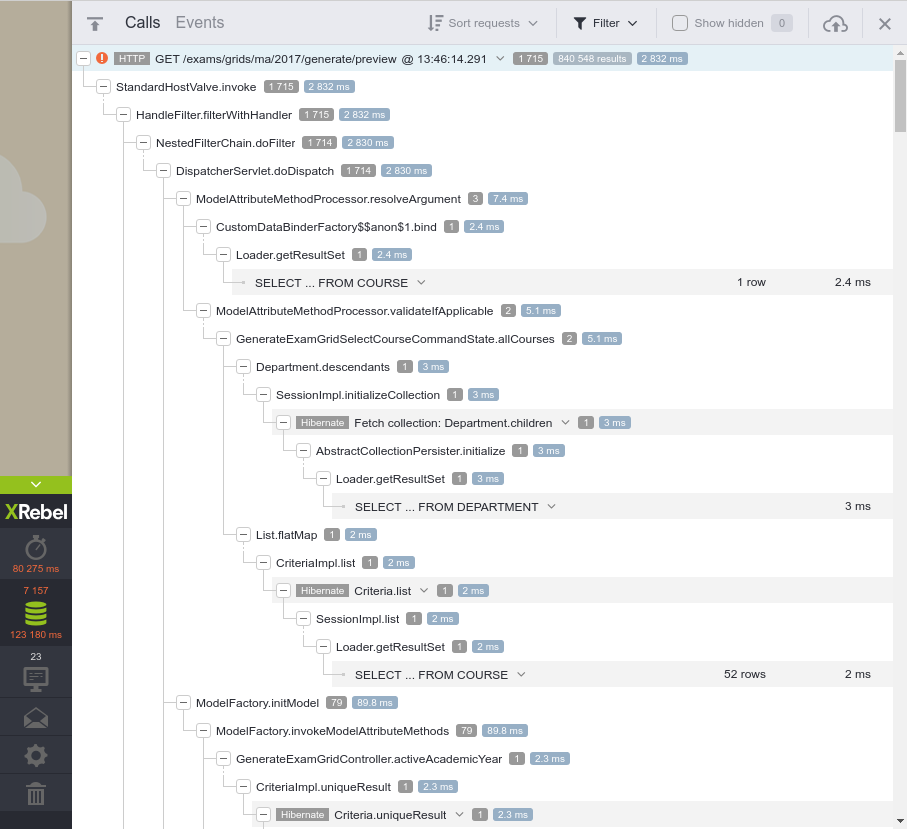
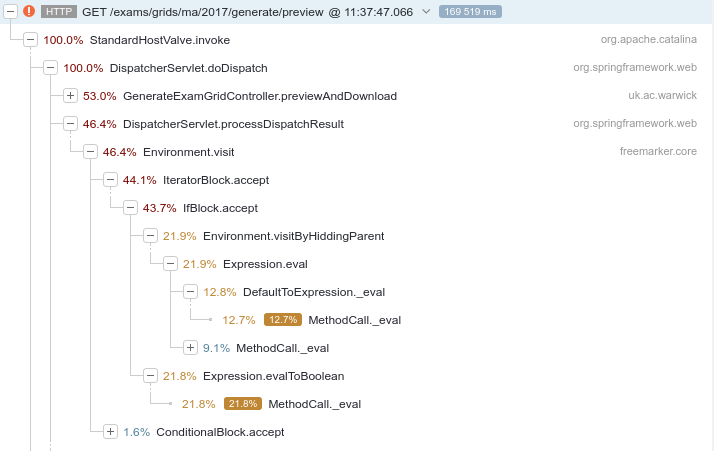
We can see that a large proportion of time, nearly 50%, is spent reading data from a socket. This is actually streaming information from the database, because we've made a bad optimisation and we're loading too many rows; 840,548 rows to be exact. Even though this "only" takes 2.8s on the database server, the time it takes to stream it across the wire and for Hibernate to reconstruct POJOs makes it now the defining factor. Walking back up the stack, we can see that it's being triggered from ModuleRegistration.upstreamAssessmentGroupMembers; re-structuring the query to be better makes a big difference.
It was around this time that we turned our attention to the database technology. We know that we don't spend a lot of time actually running the queries, but the nature of the architecture means that it's a shared resource with other applications. At this point we were using Oracle RAC, a clustered database solution that is licensed on a per-CPU basis, which means that to save money the database is shared with multiple other applications and throttled on the number of CPUs it can use on servers. We've started to move new applications to PostgreSQL since last summer, which fits more with our model of having a dedicated resource per application, per deployment, so we decided to move the application to being backed by a dedicated PostgreSQL database.
This was actually surprisingly easy; we rarely write raw SQL queries (and even more rarely use database technology-specific functionality) so it was mostly a case of writing code to migrate the data from one schema to another, and then to flip a switch in Hibernate to use a PostgreSQL dialect instead of an Oracle one. With some further performance tuning, we're starting to look a lot better:


We're still spending a lot of time calculating the "over-catted" module subsets (i.e. the subsets of modules that fit the course regulations where students are taking more than the minimum required number of credits) but the performance is just about passable. We then turned our attention to front-end performance, which felt very sluggish.
Chrome Dev Tools Javascript Profiler
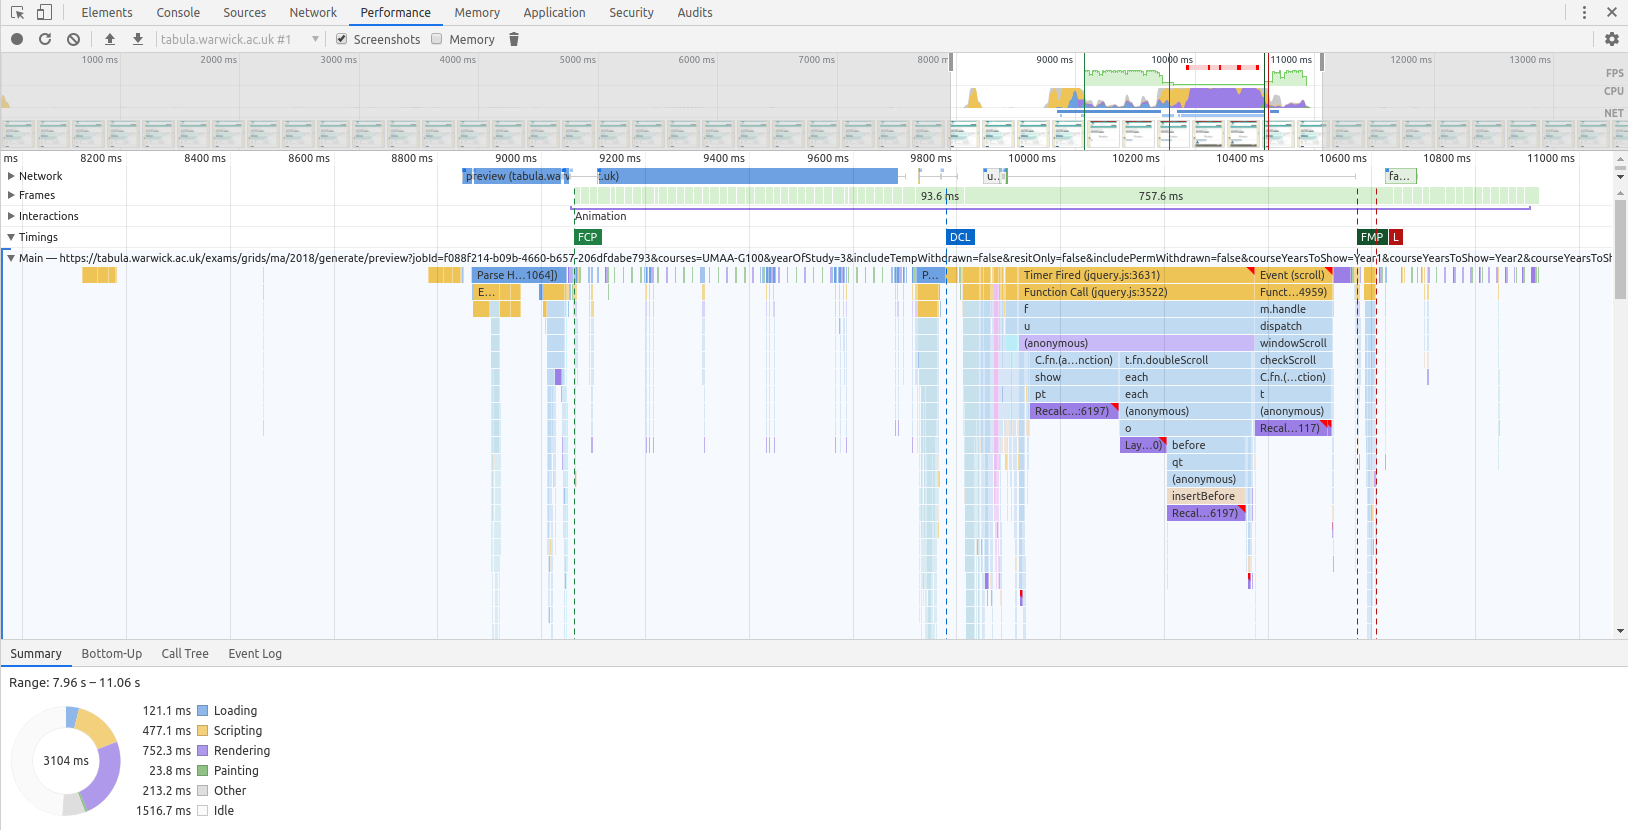
The "Performance" tab on Chrome Dev Tools (with throttling disabled) gives us a full breakdown of the client-side timings of loading the page. It's not pretty, but we can immediately see a couple of bottlenecks:
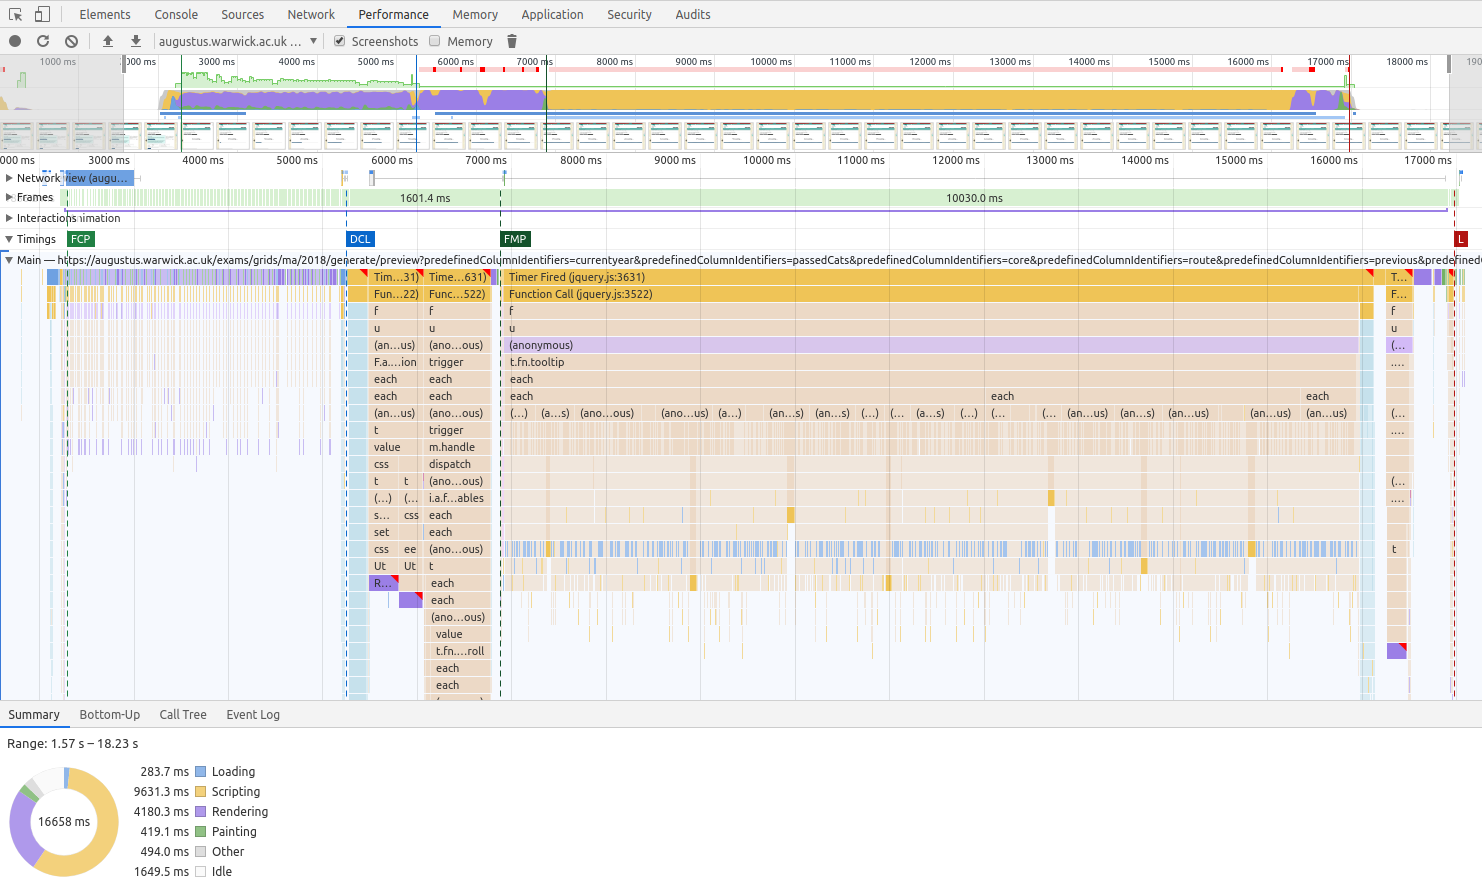
Again, it's the stack that's most useful here. It takes around 2.5s for the page to start showing the loading bar (i.e. the first contentful paint, or FCP; in this trace Chrome shows the FCP as being early but the screenshots in the timing bar tell a different story); 5.2s for the DOMContentLoaded event (DCL) where most of the JavaScript starts to be executed; 6.9s for the first meaningful paint (FMP) where we'd expect to see the grid rendered but actually we don't because the CPU is pinned initialising Bootstrap tooltips, and then the final onLoad event at 17s.
We can get a good idea of where the time goes by clicking on the various parts of the stack, which allows us to dive into the JS itself:

A quick interrogation of the page explains a lot:
>  $x("//*[contains(@class, 'use-tooltip')]").length
<- 3185
So we're initialising over 3,000 Bootstrap tooltips here, all being positioned in the right place and injecting content into the DOM. This takes 9 seconds on a high-end developer PC; you can imagine what it's like on a 2nd gen iPad - a common target device for academics. The tooltips are important as part of the preview; the majority of them are shown when marks are missing and give a hint as to why they're missing, or why a value couldn't be calculated, so we don't want to remove them entirely. Instead, let's use a bit of CSS in order to remove the need for JavaScript entirely:
Combine that with a few optimisations to take the other slow parts of the initialisation out, and our render profile starts to look a lot better:
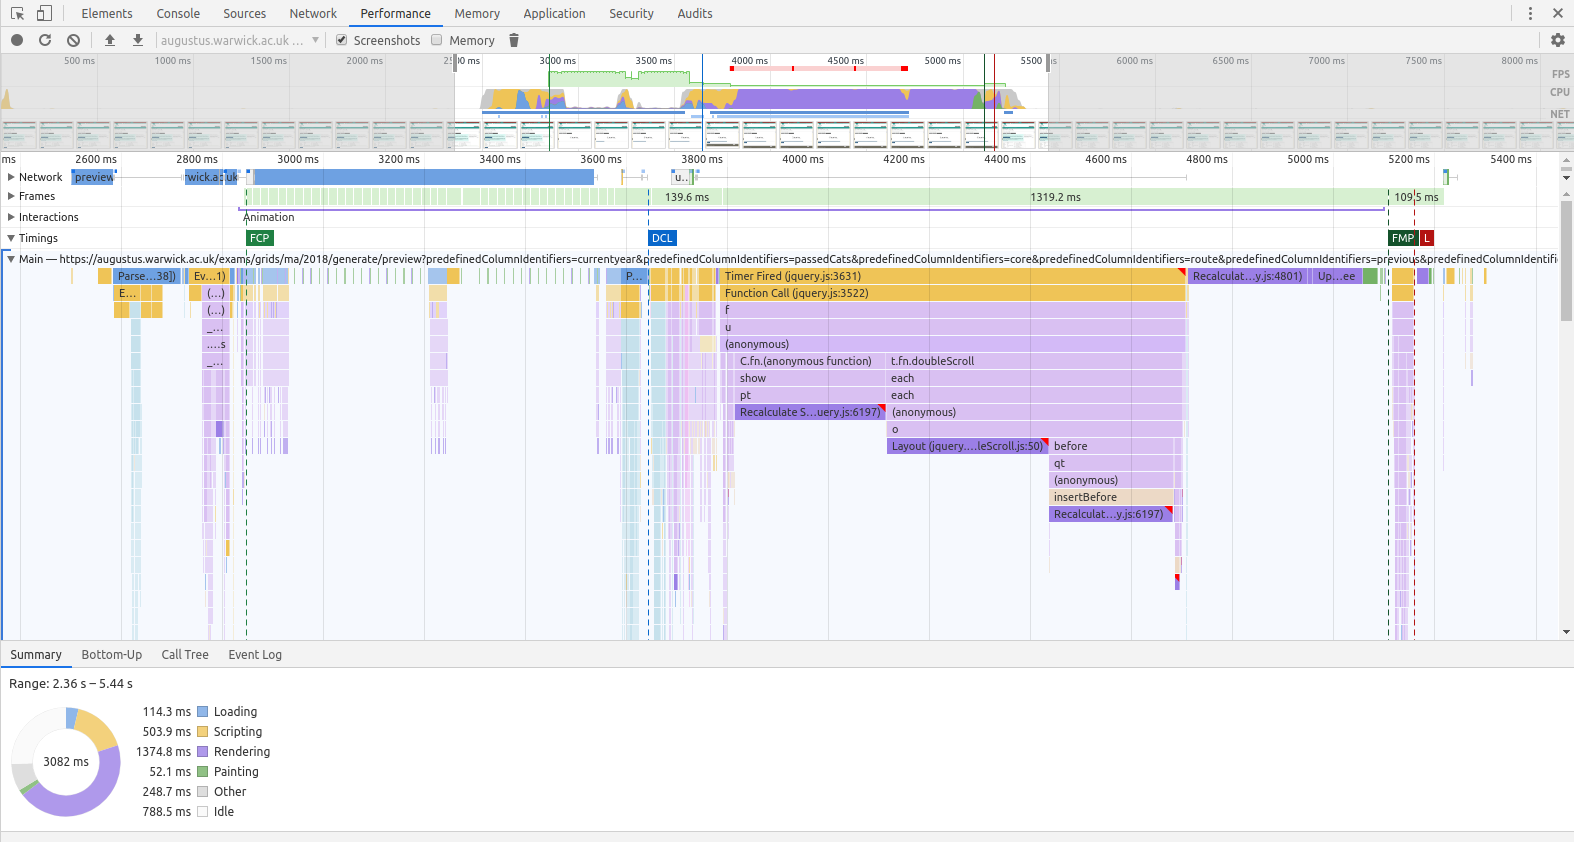
For a very complicated table, that's certainly more usable. You would've thought we'd have got a lot of optimisations on the Excel spreadsheet part for free, given that it's just a different visual representation of the same data, but we were still seeing some horrible performance numbers (in some cases, up to tens of minutes) for Excel downloads of grids that we were displaying previews of in under 10 seconds. We could use XRebel but that's a bit of a slow feedback loop for something that doesn't require a servlet container, so we decided to profile directly in the IDE.
IntelliJ IDEA Profiler
IntelliJ IDEA has a fully functional profiler built into the IDE, so the easiest way to profile the code is to build a representative test case (no mean feat to generate the levels of data we need). The IDEA profiler needs a little bit of set up, and then a configuration needs adding in Settings > Build, Execution, Deployment > Java Profiler, but then you can run tests with the profiler.
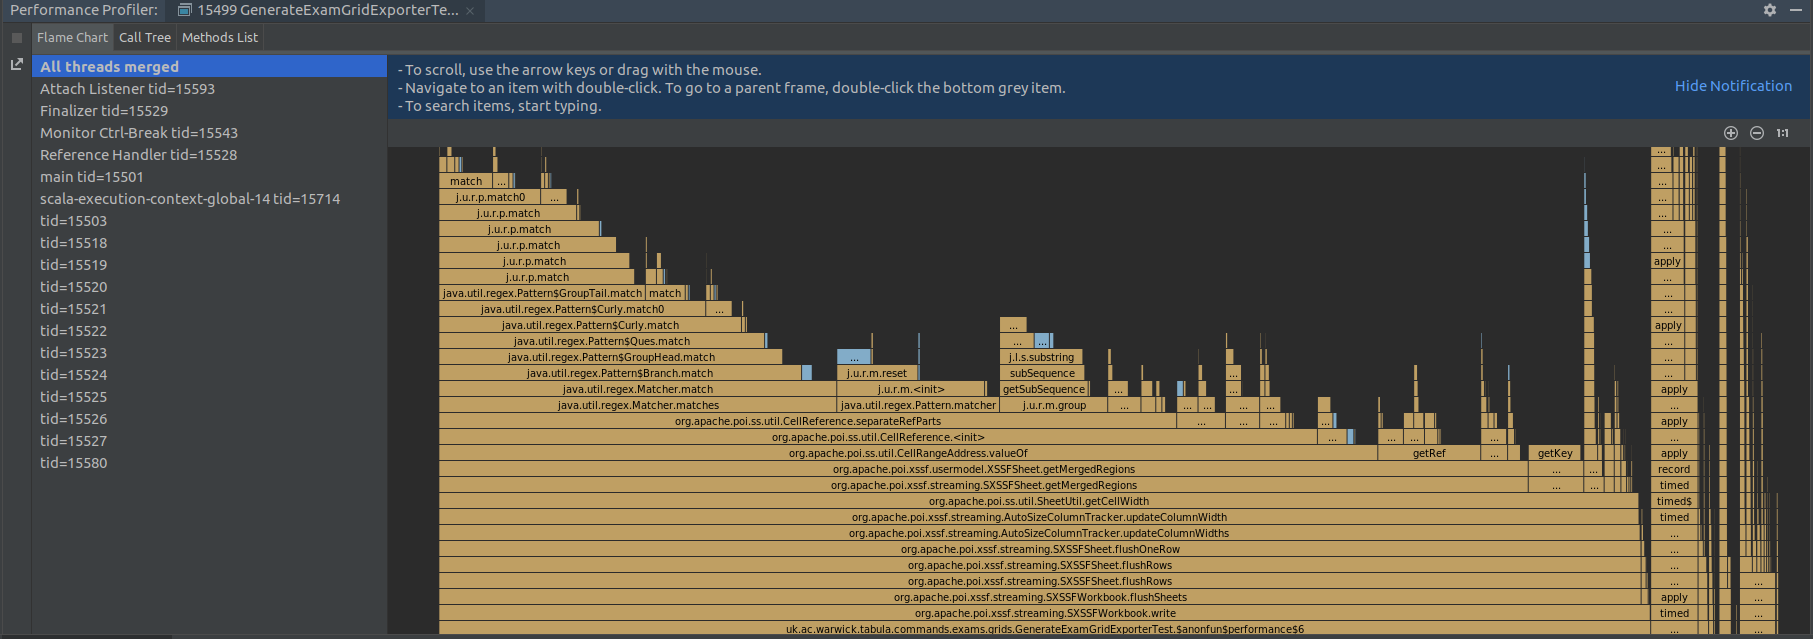
As it turns out, the problem was down to Apache POI, the library we use to generate Excel spreadsheets. Once you've turned auto-sizing on for a column, every time you add a new cell it iterates through every set of merged cells in the whole document, using a regular expression to parse out the merge constraints, just to get the current width. We have a lot of merged regions on the spreadsheet we generate, because there are multiple rows for each student, and that's what makes it slow. Simply setting exact column widths turns a 50-second test (for our test data) into a 0.25s test.
Everything is fine
When we started the exercise, our worst case scenario tests were awful - we had examples of where downloading an Excel grid was taking 20 minutes for certain cohorts of students with certain options; this nows takes just over 30 seconds, even with the most complex of options.